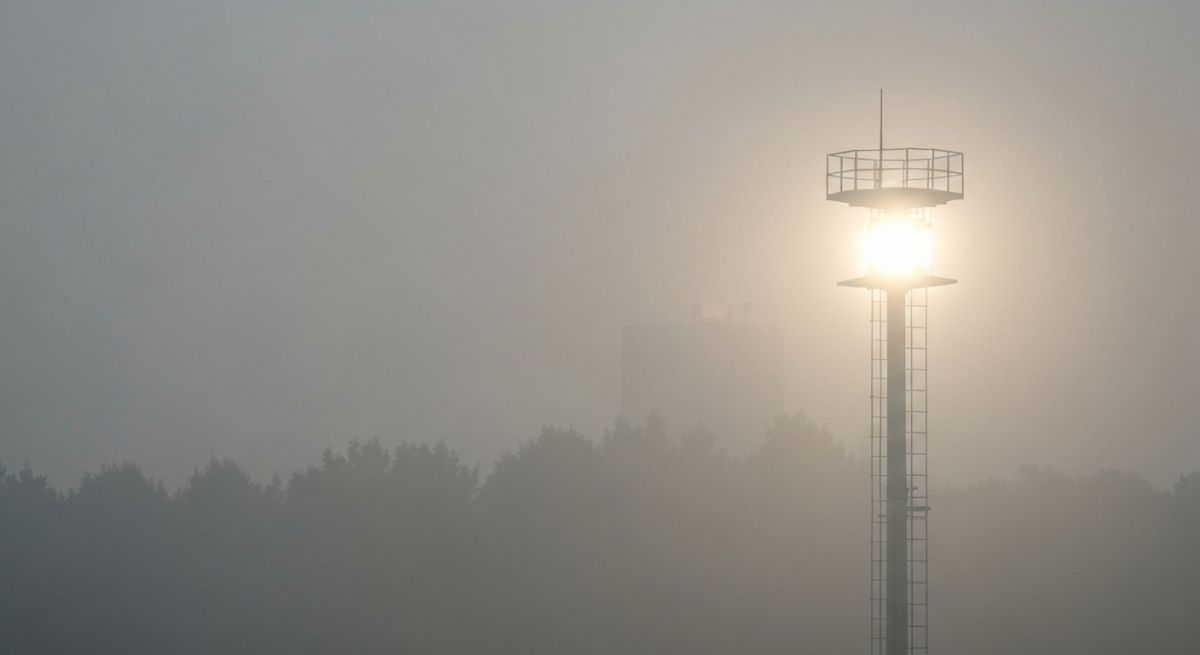
On a smoggy winter morning in a north Indian city, one number can decide whether schools open, whether construction stops, and whether parents are told to keep the children inside. One figure, on a simple scale. It looks almost too tidy for the job it does.
It isn’t tidy underneath. That single number is the end product of a fair amount of measurement and arithmetic, and once you see how it is assembled, a lot of the confusion around it — why two apps disagree, why it spikes, why it seems to overreact — quietly resolves.
The problem the AQI is actually solving
Air pollution is not one thing. It is many substances at once, each measured in its own units at wildly different concentrations. Fine particles are counted in micrograms per cubic metre. Some gases are measured in parts per billion. Hand a non-specialist that raw table and it means almost nothing.
So the Air Quality Index does a translation. It takes that jumble and turns it into a single comparable number with a plain-language health message attached. In India, the national AQI launched under a deliberately blunt slogan — “One Number, One Colour, One Description” — and is overseen by the Central Pollution Control Board (CPCB), the statutory body that sits under the Ministry of Environment, Forest and Climate Change. The point was always the same: give people one figure they can actually act on, colour-coded from good to severe.
What goes into the index
India’s AQI draws on a set of key pollutants, each chosen because it does measurable harm:
- PM2.5 — fine particulate matter, small enough to reach deep into the lungs and cross into the bloodstream.
- PM10 — coarser particulate matter, dust included.
- Ozone (O3) — ground-level ozone, cooked up by reactions in sunlight.
- Nitrogen dioxide (NO2) — largely vehicles and combustion.
- Sulphur dioxide (SO2) — mainly the burning of fossil fuels.
- Carbon monoxide (CO) — from incomplete combustion.
- Ammonia (NH3) and lead (Pb) — both part of the national scheme.
A monitoring station measures each of these, averaged over a set time window. And the window matters more than people assume. Particulate matter is typically assessed over 24 hours; some gases are read over shorter periods, because the harm they do depends on how long you breathe them. Same air, different clocks.
From a concentration to a sub-index
The real machinery is the step that turns each pollutant’s concentration into its own score — its sub-index. For every pollutant, health experts have fixed a series of concentration breakpoints: ranges that line up with bands of the index scale. Those bands run from Good and Satisfactory, through Moderate and Poor, to Very Poor and Severe.
To find a pollutant’s sub-index, you locate its measured concentration between the breakpoints for its band and calculate a proportional value inside that band, using linear interpolation. Put plainly: if a reading sits about a third of the way up its concentration band, the sub-index sits roughly a third of the way up the matching index band. This happens separately for each pollutant. So a single station can post a high PM2.5 sub-index and a low SO2 sub-index on the very same day, and both are correct.
The rule that surprises everyone
Here is the part that catches people out. The overall AQI for a location is not an average of the pollutant sub-indices. It is the worst one. The final AQI equals the single highest sub-index among all pollutants measured, and that pollutant gets named the “dominant” or responsible pollutant for the day.
Why so unforgiving? Because the logic is protective by design. If the air is thick with fine particles, it is no comfort at all that the gases happen to be low — the danger is set by the worst offender in the mix. Taking the maximum means the index can never quietly understate the hazard by diluting one serious pollutant among several mild ones. India’s method also insists on a minimum number of pollutants being measured, including at least one particulate pollutant, before a station’s AQI counts as valid.
Why two nearby stations can disagree
People get suspicious when one source shows a city at one number and another shows something else. Usually there is nothing sinister in it. The value depends on which monitoring station you happen to be reading — a roadside monitor sitting in traffic will not match one in a leafy park. It depends on the averaging window and the exact minute of the reading. And a headline “city” figure may be an aggregate stitched from many stations. The numbers aren’t broken. Air quality genuinely varies, street to street and hour to hour.
Read the band, not just the digits
Every AQI band comes with a colour and a health advisory spelling out likely effects and who should be careful. The lower bands mean air that poses little risk to most people. Higher up, the warnings arrive first for sensitive groups — children, older people, anyone with heart or lung conditions — and then widen to the general population. At the top of the scale the advisory reaches everyone, and it often triggers official measures on the ground.
Because the exact numeric cut-offs and, of course, the live readings shift with policy revisions and daily conditions, the reliable place to check current values and the band definitions in force is the CPCB’s own dashboard, published through its National Air Quality Index portal.
What the number can’t tell you
The AQI is a powerful summary. It is not the whole story, and it helps to know its blind spots. It reflects outdoor air near a monitor — not the air in your kitchen or your office. It is built only from the pollutants on the official list, so anything outside that list simply isn’t captured. And a single daily figure irons out spikes; a short, sharp burst of very high pollution can happen inside a day that a 24-hour average softens into something milder. Read the index as a guide, not as a precise measure of your personal exposure. That is the sensible posture.
The bottom line
Strip it down and the AQI is a translation device. It takes several pollutants, each measured in its own way, converts each into a comparable sub-index using health-based breakpoints, and then reports the worst of them as one number with a colour and an advisory. Hold on to the one fact that explains the rest — the final figure is a maximum, not an average. That is why it can look alarming on a hazy morning, and why it is built, on purpose, to err on the side of caution. For the live figures, always go straight to the official CPCB source.
For more explainers on health and everyday life, see our Lifestyle section.